The Problem
Your 2027 IT budget is already being built. And it is already wrong.
Not because you are bad at your job. Because the tools you are using to build it have never been connected to the business that drives it.
Every ITAM tool tells you what you licensed. Every TBM platform tells you how you allocated it. Every FinOps tool tells you where your cloud money went. Not one of them knows what your business plan costs in technology. Not one of them connects your VMware Broadcom renewal to your cloud migration strategy. Not one of them has modeled what adding 300 employees costs across 14 vendor contracts, your contractor population, your MSAs, and your HR compensation plan simultaneously.
When the CFO asks for a 10 percent cut, StackTrack already knows exactly where it comes from, what gets protected, and what the downstream impact is on every strategic initiative before anyone starts scrambling.
That is the difference between a budget and a model.
The organization in this case study manages $85M in annual technology spend across 2,800 employees, 4,200 enterprise customer accounts, and $380M in annual revenue growing to $464M in 2027. What follows is the complete 2027 AOP StackTrack produced.
The Input
What we told StackTrack
StackTrack BudgetTrack Module
Build our 2027 IT Annual Operating Plan.
You know our business: $380M revenue growing to $464M (22%). 4,200 customer accounts growing to 4,956 (18%). 2,800 employees growing to 3,100. Current technology spend: $85M.
You know our strategy: 40% gross margin target by Q3. EU market entry Q2. AI-first product development. 30% developer productivity improvement. 15% cloud unit economics improvement.
You know our people: 280 technology FTEs, 94 active contractors, 6 master services agreements.
You know our contracts: every renewal date, every escalation clause, every tier threshold, every out-year commitment including the VMware Broadcom renewal.
Build the 2027 plan. Show me everything.
StackTrack had been connected to this organization's billing data, HR planning system, contract repository, and business plan since the beginning of the fiscal year. The system had been building this answer since January. What follows is what it produced.
Strategic Context
Before a single dollar is budgeted
StackTrack maps every technology investment to the corporate priority it serves before building the plan. This changes how the budget is structured, defended, and presented to the board.
Priority 1 — 40% Gross Margin by Q3
Budget postureEvery discretionary spend increase requires productivity ROI
Defensive
AI investments approved where they reduce labor cost or accelerate revenue
Conditional
Discretionary spend freeze until Q3 gross margin target is confirmed
Enforced
Priority 2 — EU Market Entry Q2
GDPR, data residency, local CDN, EU identity managementMandatory regulatory investment — not IT overhead
$4.2M ring-fenced
StackTrack recommendation: present EU technology investment separately to the board as market entry capital. Removes $4.2M from IT overhead narrative entirely.
Priority 3 — AI-First Product Development
AI investment classified as strategic capital, not operating expense
Strategic
ROI target: 30% developer productivity improvement, 20% reduction in time to feature
Measured quarterly
If productivity gains are not materializing by Q2, StackTrack flags the investment for review before Q3 budget lock.
Efficiency Curve
Is technology becoming more or less efficient as the business scales?
This is the question every CFO asks and no technology leader has ever been able to answer with data. StackTrack tracks technology spend as a percentage of revenue over time and projects the trend forward automatically.
2024
26.0%
$68M / $262M revenue
2025
23.7%
$74M / $312M revenue
↓
2026
22.4%
$85M / $380M revenue
↓
2027 gross
22.2%
$103M gross / $464M
↕
2027 optimized
21.1%
$97.75M / $464M revenue
↓
Board narrative StackTrack generates automatically
As we scale from $380M to $464M, our technology investment grows 14.9% while revenue grows 22%. The efficiency reversal in 2027 is driven by three non-recurring factors: VMware Broadcom repricing, EU market entry compliance (presented separately as capital), and contractor normalization. Excluding these, underlying efficiency continues improving. For every $1.00 of technology investment in 2027, we generate $2.40 in incremental revenue — up from $1.74 in 2024.
Section 1 of 7
Labor — the full picture
Labor is the largest and most complex driver in the technology budget. StackTrack connects directly to HR planning to model every dimension simultaneously.
Technology FTEs — 280 current, 22 net new planned
Current fully loaded technology FTE cost
$42,000,000
HR planning: 4.2% average merit increasePulled directly from HR compensation model
+$1,764,000
Benefits cost increase: 6.8% healthcare inflationHR actuarial estimate
+$468,000
22 net new technology FTEs at $185,000 fully loaded average
+$4,070,000
Contractor Population — 94 active contractors
Current contractor spend
$18,800,000
Master rate card escalation: 3.8% average across 6 preferred vendors
+$714,000
Scope expansion: AI mandate and EU market entry
+$1,400,000
Contractor to FTE conversion opportunity14 contractors in roles suited for FTE at lower fully loaded cost
-$840,000
Master Services Agreements — 6 active MSAs
Infrastructure managed services: CPI + 2.5% escalator per agreement
+$186,000
Application managed services: headcount-linked scope expansion
+$240,000
Security operations center: EU market entry scope expansion
+$320,000
Help desk and end user services: 300 new seats
+$108,000
Network operations: flat rate agreement
$0
Data center managed colocation: workload growth
+$144,000
Total labor and services 202760.1% of total technology budget — within 55-65% industry benchmark
$69,374,000
Section 2 of 7
VMware — the $4M decision hiding in your 2027 budget
The Broadcom acquisition of VMware is the most significant single pricing event in enterprise technology in the last decade. Organizations with a 2027 renewal face three very different paths. StackTrack models all of them before the negotiation window opens.
Current state
2026 VMware perpetual maintenance cost
$1,840,000
⚠
Critical: Broadcom has discontinued perpetual licensing. 2027 renewal requires migration to VMware Cloud Foundation subscription model. This is not optional. Migration planning must begin no later than October 2026.
Scenario A
Accept Broadcom VCF at proposed terms
$5,980,000
3-year total: $17,940,000
225% increase. Locks to Broadcom pricing trajectory with limited out-year negotiation leverage.
Scenario B
Negotiate multi-year VCF commitment for rate cap
$4,200,000
3-year total: $12,600,000
128% increase. Committed 3 years during period of significant cloud migration pressure.
Scenario C — Recommended
Migrate 40% of workloads to cloud in H1, retain VCF for remainder
$2,940,000
3-year total: $8,820,000
Lowest 3-year cost. Aligns with cloud-first strategy. Engage AWS and Azure for migration credits before VMware negotiation begins.
2027 budget impact using Scenario C
+$2,080,000
Savings vs accepting Broadcom terms (Scenario A)
-$3,040,000
Section 3 of 7
Tier 1 renewals — every window, every lever
Salesforce EA — February 14 renewal
CPI + 4% escalator per agreement
+$247,000
120 net new sales seats
+$720,000
API volume growth at 22% revenue increase
+$94,000
Utilization currently 71% — negotiation leverage before renewal
-$186,000
Net Salesforce impact
+$875,000
ServiceNow — March 3 renewal
⚠
Tier threshold alert: You are at 3,180 seats. The tier upgrade triggers automatically at 3,200. You are 20 employees away from a $550,000 automatic cost increase. Negotiate tier renegotiation before March 3 or sequence hiring to stay below threshold until after renewal closes.
If tier renegotiated before renewal
+$340,000
If tier triggers automatically
+$890,000
AWS — March 15 renegotiation
Expand committed-use from 68% to 80% coverage (benchmark: 82%)
-$600,000
Savings plan optimization across reserved instances
-$180,000
Microsoft EA — July renewal
300 new M365 E3 seats at blended rate
+$162,000
Azure consumption growth tied to AI workloads
+$144,000
Power Platform growth tied to AI mandate
+$96,000
Net Microsoft impact
+$402,000
Section 4 of 7
Business driver cascade
When the CEO says revenue grows 22% next year, your technology budget does not stay flat. StackTrack maps every business growth metric to the vendor contracts and infrastructure it activates.
Revenue growth ($380M to $464M, +22%)
Snowflake: data volume grows 28% at your historical revenue correlation
+$480,000
Gainsight: approaching 5,000 account tier threshold — negotiate now
+$336,000
Payment infrastructure: scales to incremental $84M in transactions
+$252,000
Datadog: usage-based scaling to infrastructure growth
+$144,000
Customer account growth (4,200 to 4,956, +18%)
Zendesk: enterprise support scaling, ticket volume growth 22%
+$462,000
Okta customer identity: 756 new enterprise SSO tenants
+$350,400
Customer onboarding and professional services tooling
+$220,500
Security scope: EU customer accounts trigger data sovereignty requirements
+$276,000
Headcount growth (2,800 to 3,100, +300 net new)
Slack, Workday, Zoom, Confluence, Jira: seat cascade across 14 contracts
+$198,000
Security stack: CrowdStrike, Intune, zero-trust per new employee
+$372,000
HR technology: ATS, learning and development, onboarding per new hire
+$121,500
AI mandate (100% engineering coverage by Q2)
GitHub Copilot Enterprise: 180 engineers
+$388,800
Claude API, Azure OpenAI, Cursor Pro: internal and customer-facing
+$762,400
AI infrastructure, vector database, LLM observability
+$240,000
Right-sizing: 34% of API calls using premium models for commodity tasks
-$284,000
Sections 5, 6 and 7 of 7
The rest of the picture
Most budget processes stop at the top 10 vendors. StackTrack tracks everything across your entire technology estate.
Tier 2 and Tier 3 SaaS vendors (84 active vendors, $6.4M total spend)
One-third renewing in 2027 (28 vendors, $2.1M in scope)Average price increase at this tier: 8.4% per StackTrack benchmark data
+$179,000
Consolidation opportunity: 12 vendors with overlapping capability identified
-$240,000
Net Tier 2/3 impact
-$61,000
Hardware, infrastructure, and operations
300 new employee devices + scheduled fleet refresh (18% end of life)
+$1,026,000
EU server infrastructure for data sovereignty compliance
+$320,000
Oracle and IBM software maintenance plus legacy application support
+$306,000
Telecom and connectivity: EU offices, mobile for new employees
+$324,000
Cyber insurance: premium increase driven by customer and data growth
+$380,000
Technology debt remediation (priority scope only)
+$360,000
Training and certification: AI, cloud, security programs
+$294,000
Facilities and colocation: EU plus primary data center expansion
+$456,000
EU compliance — recommended: present separately as market entry capital
GDPR compliance infrastructure plus EU data residency environment
+$1,120,000
SOC 2 scope expansion plus external counsel and audit fees
+$280,000
StackTrack recommendation: present this $1.4M separately to the board as EU market entry investment. It belongs in the EU P&L, not the IT overhead narrative.
Forward Commitment Ledger
What you have already agreed to pay
Most organizations discover their out-year technology commitments when the invoice arrives. StackTrack shows every committed dollar across every contract in every out-year from day one. The CFO has never seen this before in a technology context.
2027
$71.4M
Contracts already signed
2028
$68.2M
Multi-year agreements active
2029
$42.8M
Three-year terms in effect
Total forward technology commitments already on the booksThe number your CFO has never seen in one place
$182.4M
Concentration risk: 34% of forward commitment is with three vendors — Microsoft, Salesforce, and AWS. StackTrack recommendation: diversify committed spend before next renewal cycle or negotiate break clauses.
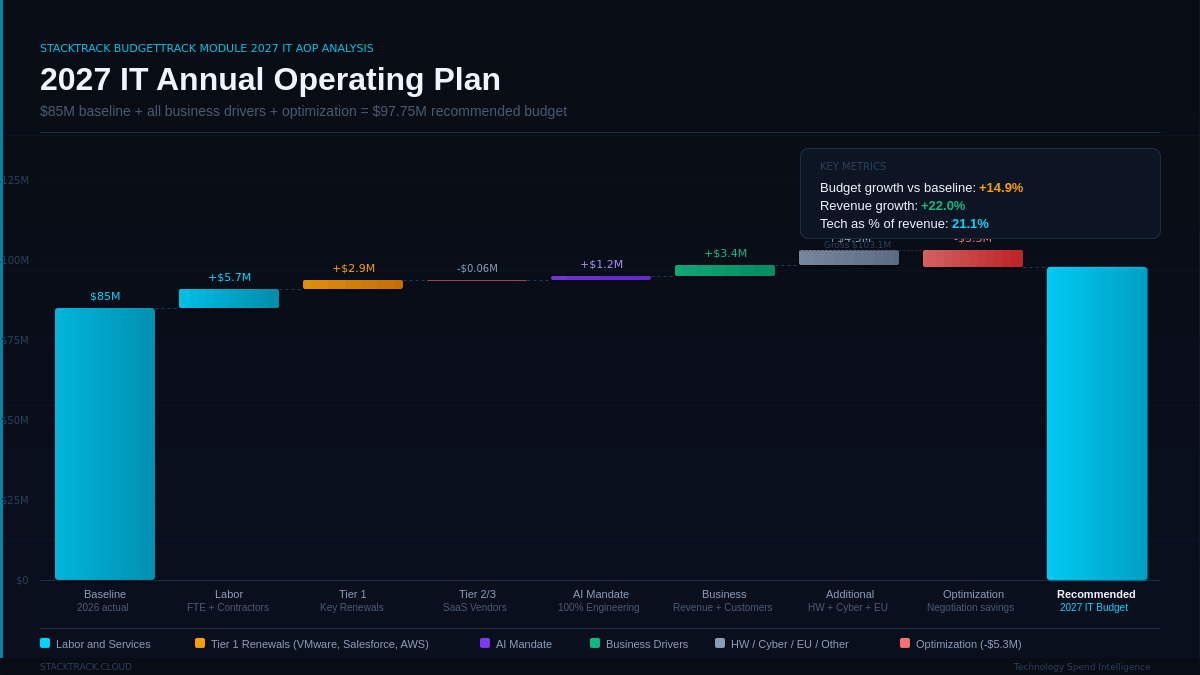
The Complete Picture
From $85M baseline to $97.75M recommended budget
Every category of increase. Every optimization. The full waterfall from baseline to board-ready recommendation.
The Recommendation
2027 IT AOP — complete summary
| Category | Amount |
|---|
| 2026 baseline | $85,000,000 |
| Labor and services — FTE merit increases, benefits, 22 new hires, contractors, MSAs | +$5,738,000 |
| VMware Broadcom — Scenario C recommended | +$2,080,000 |
| Tier 1 vendor renewals — Salesforce, ServiceNow (negotiated), AWS, Microsoft | +$837,000 |
| Tier 2 and Tier 3 vendors — net of consolidation savings | -$61,000 |
| AI mandate — Copilot, Claude API, Azure OpenAI, infrastructure, net of right-sizing | +$1,213,600 |
| Business drivers — revenue, customer, headcount cascade | +$3,398,400 |
| Hardware, software maintenance, telecom, cyber insurance, tech debt | +$2,386,000 |
| EU compliance — ring-fenced, recommend presenting separately to board | +$1,400,000 |
| Training, certification, facilities, colocation | +$1,110,000 |
| Gross 2027 requirement | $103,102,000 |
| Salesforce renewal negotiation (71% utilization leverage) | -$186,000 |
| AWS committed-use optimization to benchmark coverage | -$780,000 |
| ServiceNow tier renegotiation before threshold activates | -$550,000 |
| Gainsight account threshold negotiation before crossing | -$180,000 |
| Contractor to FTE conversion (14 roles identified) | -$840,000 |
| Tier 2 and Tier 3 vendor consolidation (12 overlapping tools) | -$240,000 |
| AI model right-sizing (34% of calls on premium for commodity tasks) | -$284,000 |
| VMware Scenario C vs accepting Broadcom terms | -$3,040,000 |
| Total optimization identified | -$6,100,000 |
| Recommended 2027 IT budget | $97,002,000 |
+14.1%
Budget growth vs 2026 baseline
21.1%
Tech spend as % of $464M revenue
$6.1M
Optimization identified before negotiations
Every dollar tied to a named business driver, a named contract, or a named strategic priority. Board-ready. CFO-defensible. Built in six days not six months.